

We believe that hearing and learning directly from participants is essential to improving programs and services, and surveys can be a very effective way to do this. If you have administered a survey to your participants, you’ve taken a valuable step! But once you’ve collected your survey responses, how do you make sense of them?
The answer may not be as straightforward as it appears—especially if your survey covers multiple topic areas. With a wealth of information available to you, it can be hard to know where to start and how to navigate the results.
We’ve put together a short primer to help you get started with survey analysis, based on a recent training that we provided to participants in our Benefits for Success CTE Academy. Survey analysis is a rich area with no small amount of complexity. While this primer is not designed to be a comprehensive guide to survey analysis, it describes 5 initial steps to take to effectively focus your analysis and avoid common pitfalls.
For the purposes of this primer, let’s assume that you’ve just administered a survey to students in a postsecondary training program to understand their experience in the program. Now that you have these survey responses, how should you interpret them? What should you do first?
1. Determine if your survey respondents are representative
Not everyone you sent the survey to will have responded, so it’s critical to understand who did. Without this understanding, you run the risk of incorrectly generalizing responses to all your students and/or misinterpreting your results.
To identify who your respondents are, ask yourself if they are representative of the population that you wanted to hear from. Did you receive responses from roughly the same racial and ethnic makeup of students as those targeted by your survey? What about gender, income, age, or other demographic factors? One way to answer this question is to compare the demographic makeup of survey respondents to what you know about your target population. For example, suppose you suspect that roughly 20% of students in your target group are low-income and you know that most low-income students at your institution receive a Pell Grant.
In your survey, you asked if respondents were receiving a Pell Grant. You received the following responses:
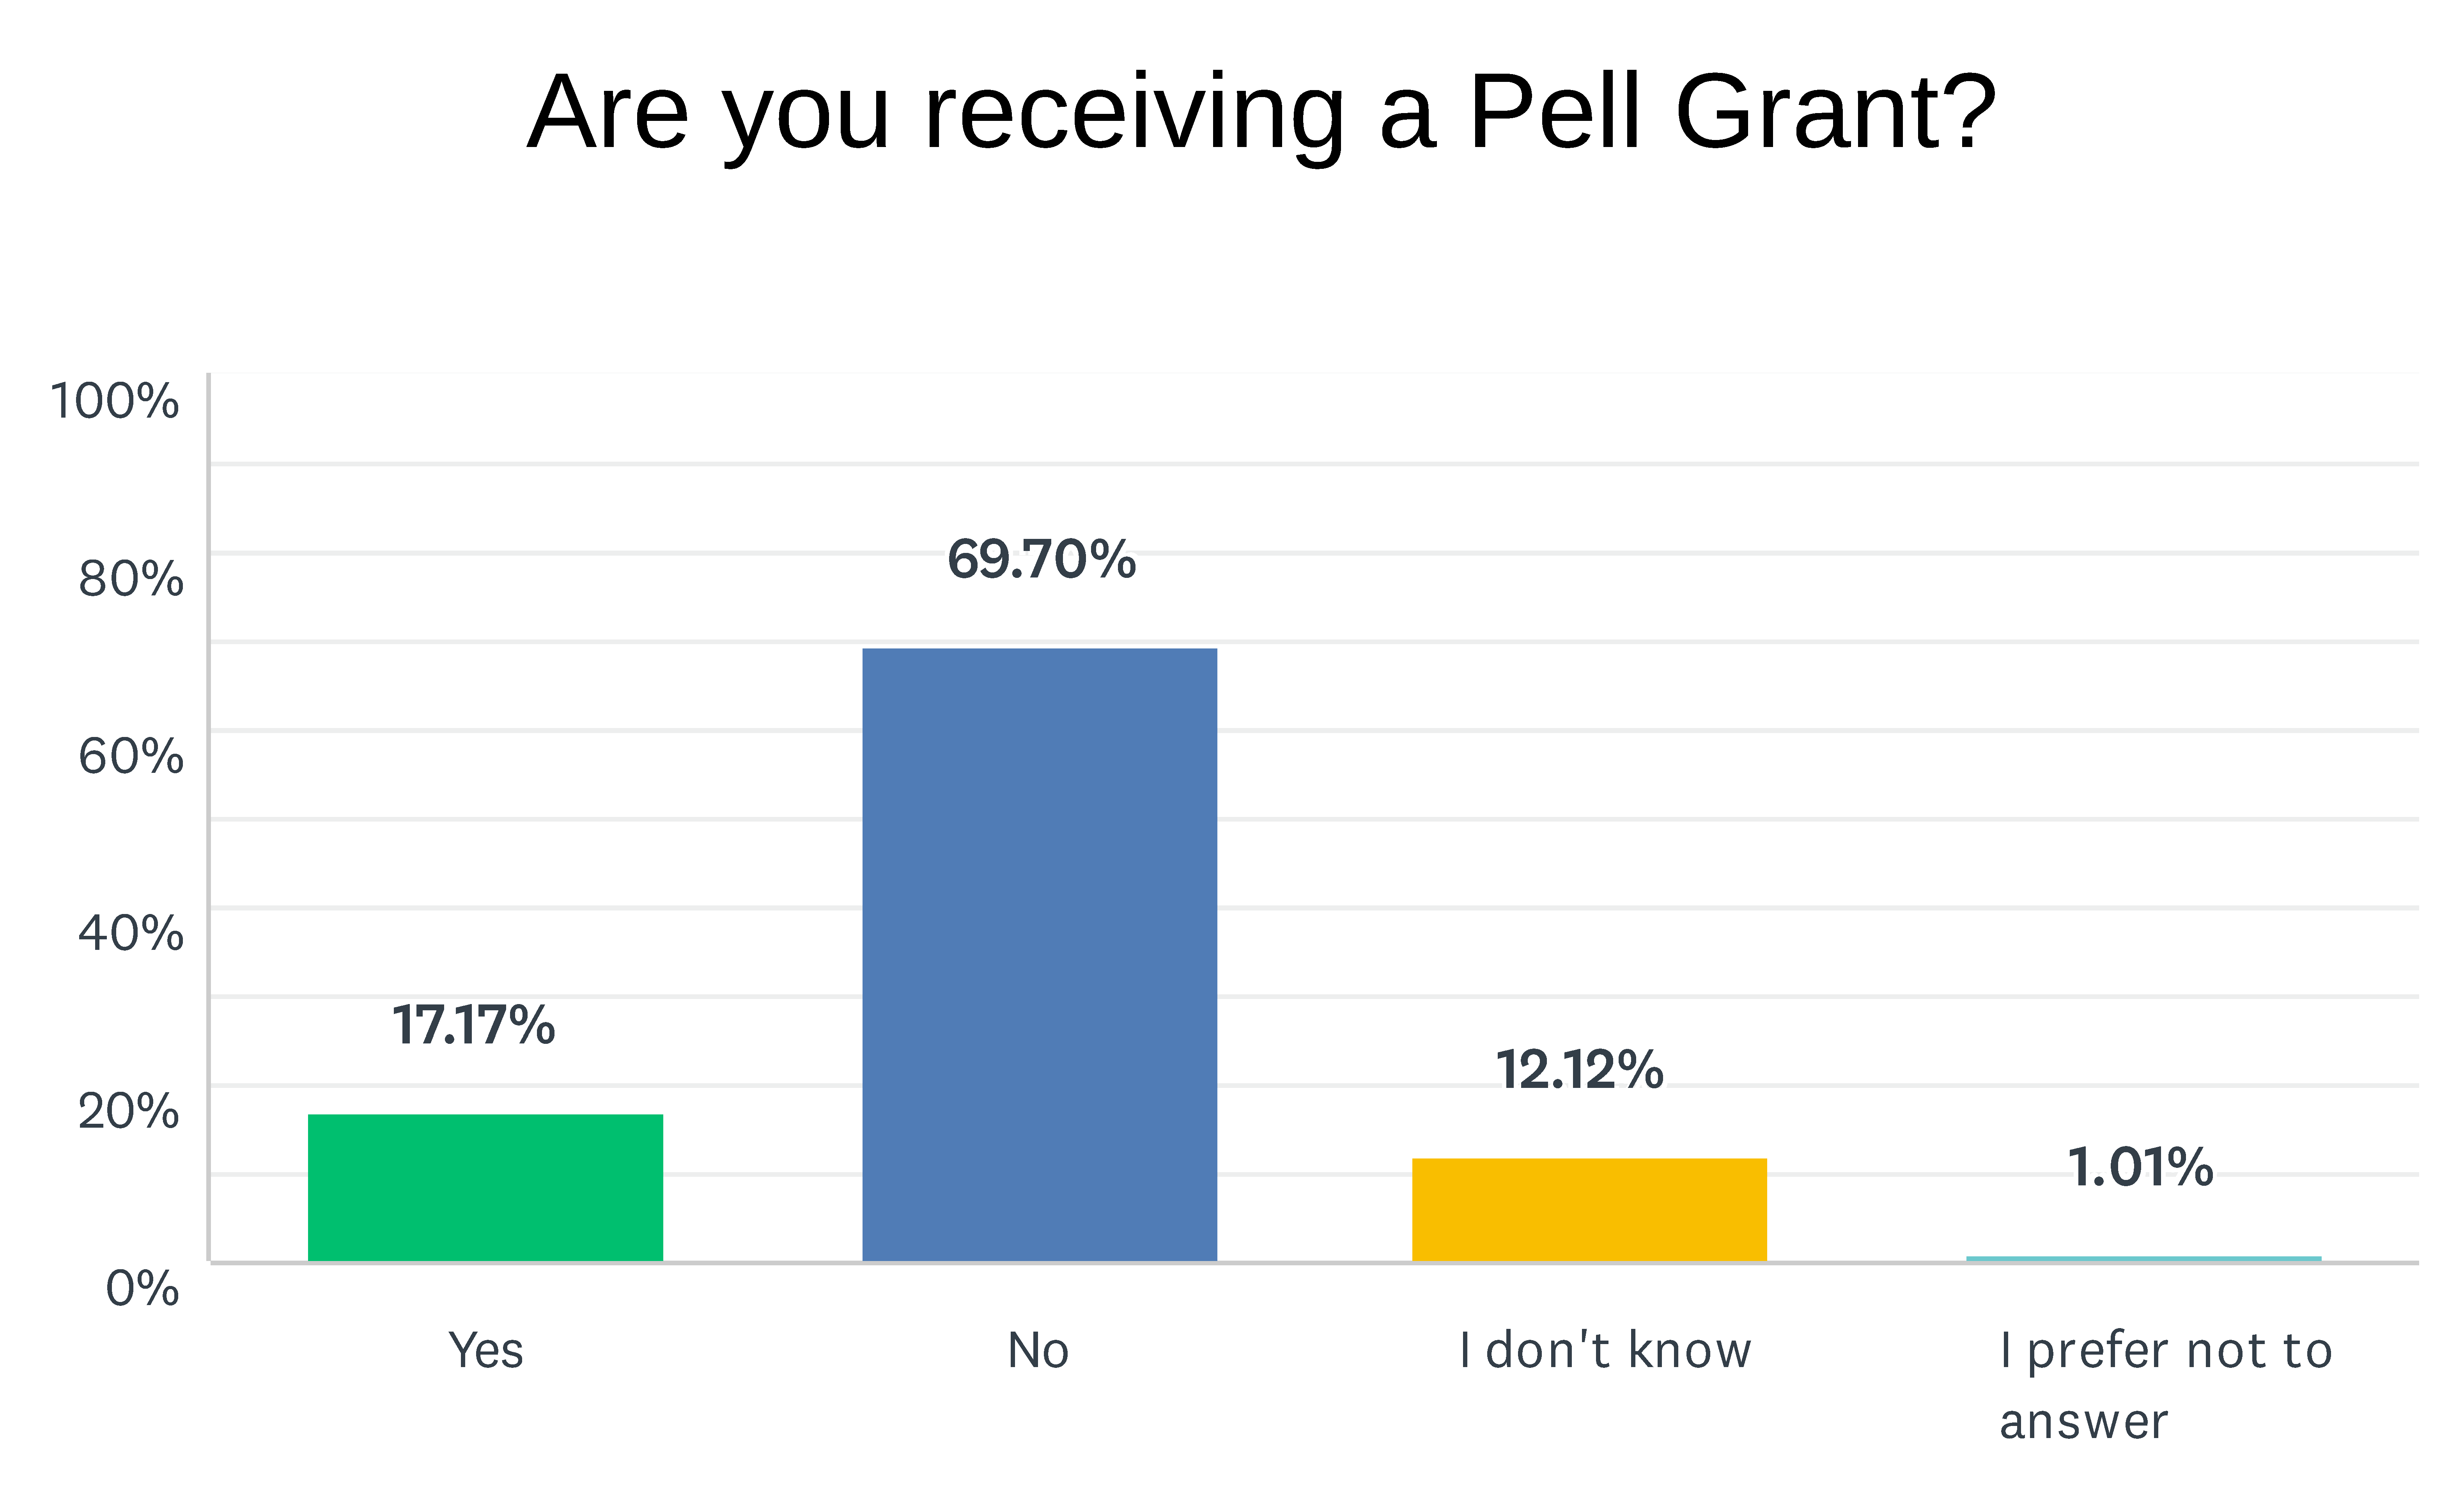
These responses suggest that at least on income level, your low-income student respondents are representative of the students you targeted for the survey.
What if your survey respondents are not representative? This could signal a need to obtain additional survey responses to help make the responses more generalizable and avoid non-response bias (see #2 below).
2. Identify any missing groups
Are you missing a key group of students that you were eager to hear from? If so, this could indicate that your survey responses are affected by non-response bias. Non-response bias occurs when people who respond to a survey differ significantly from those who do not respond to a survey. When analyzing a survey, it is important to determine if non-response bias is at play.
For example, suppose you wish to understand students’ level of need for and use of loaner laptops and wi-fi hotspots. Your responses to an online survey indicate a low level of need for these resources, as well as low usage rates. However, the majority of your respondents also indicate that they have regular access to reliable internet at home:
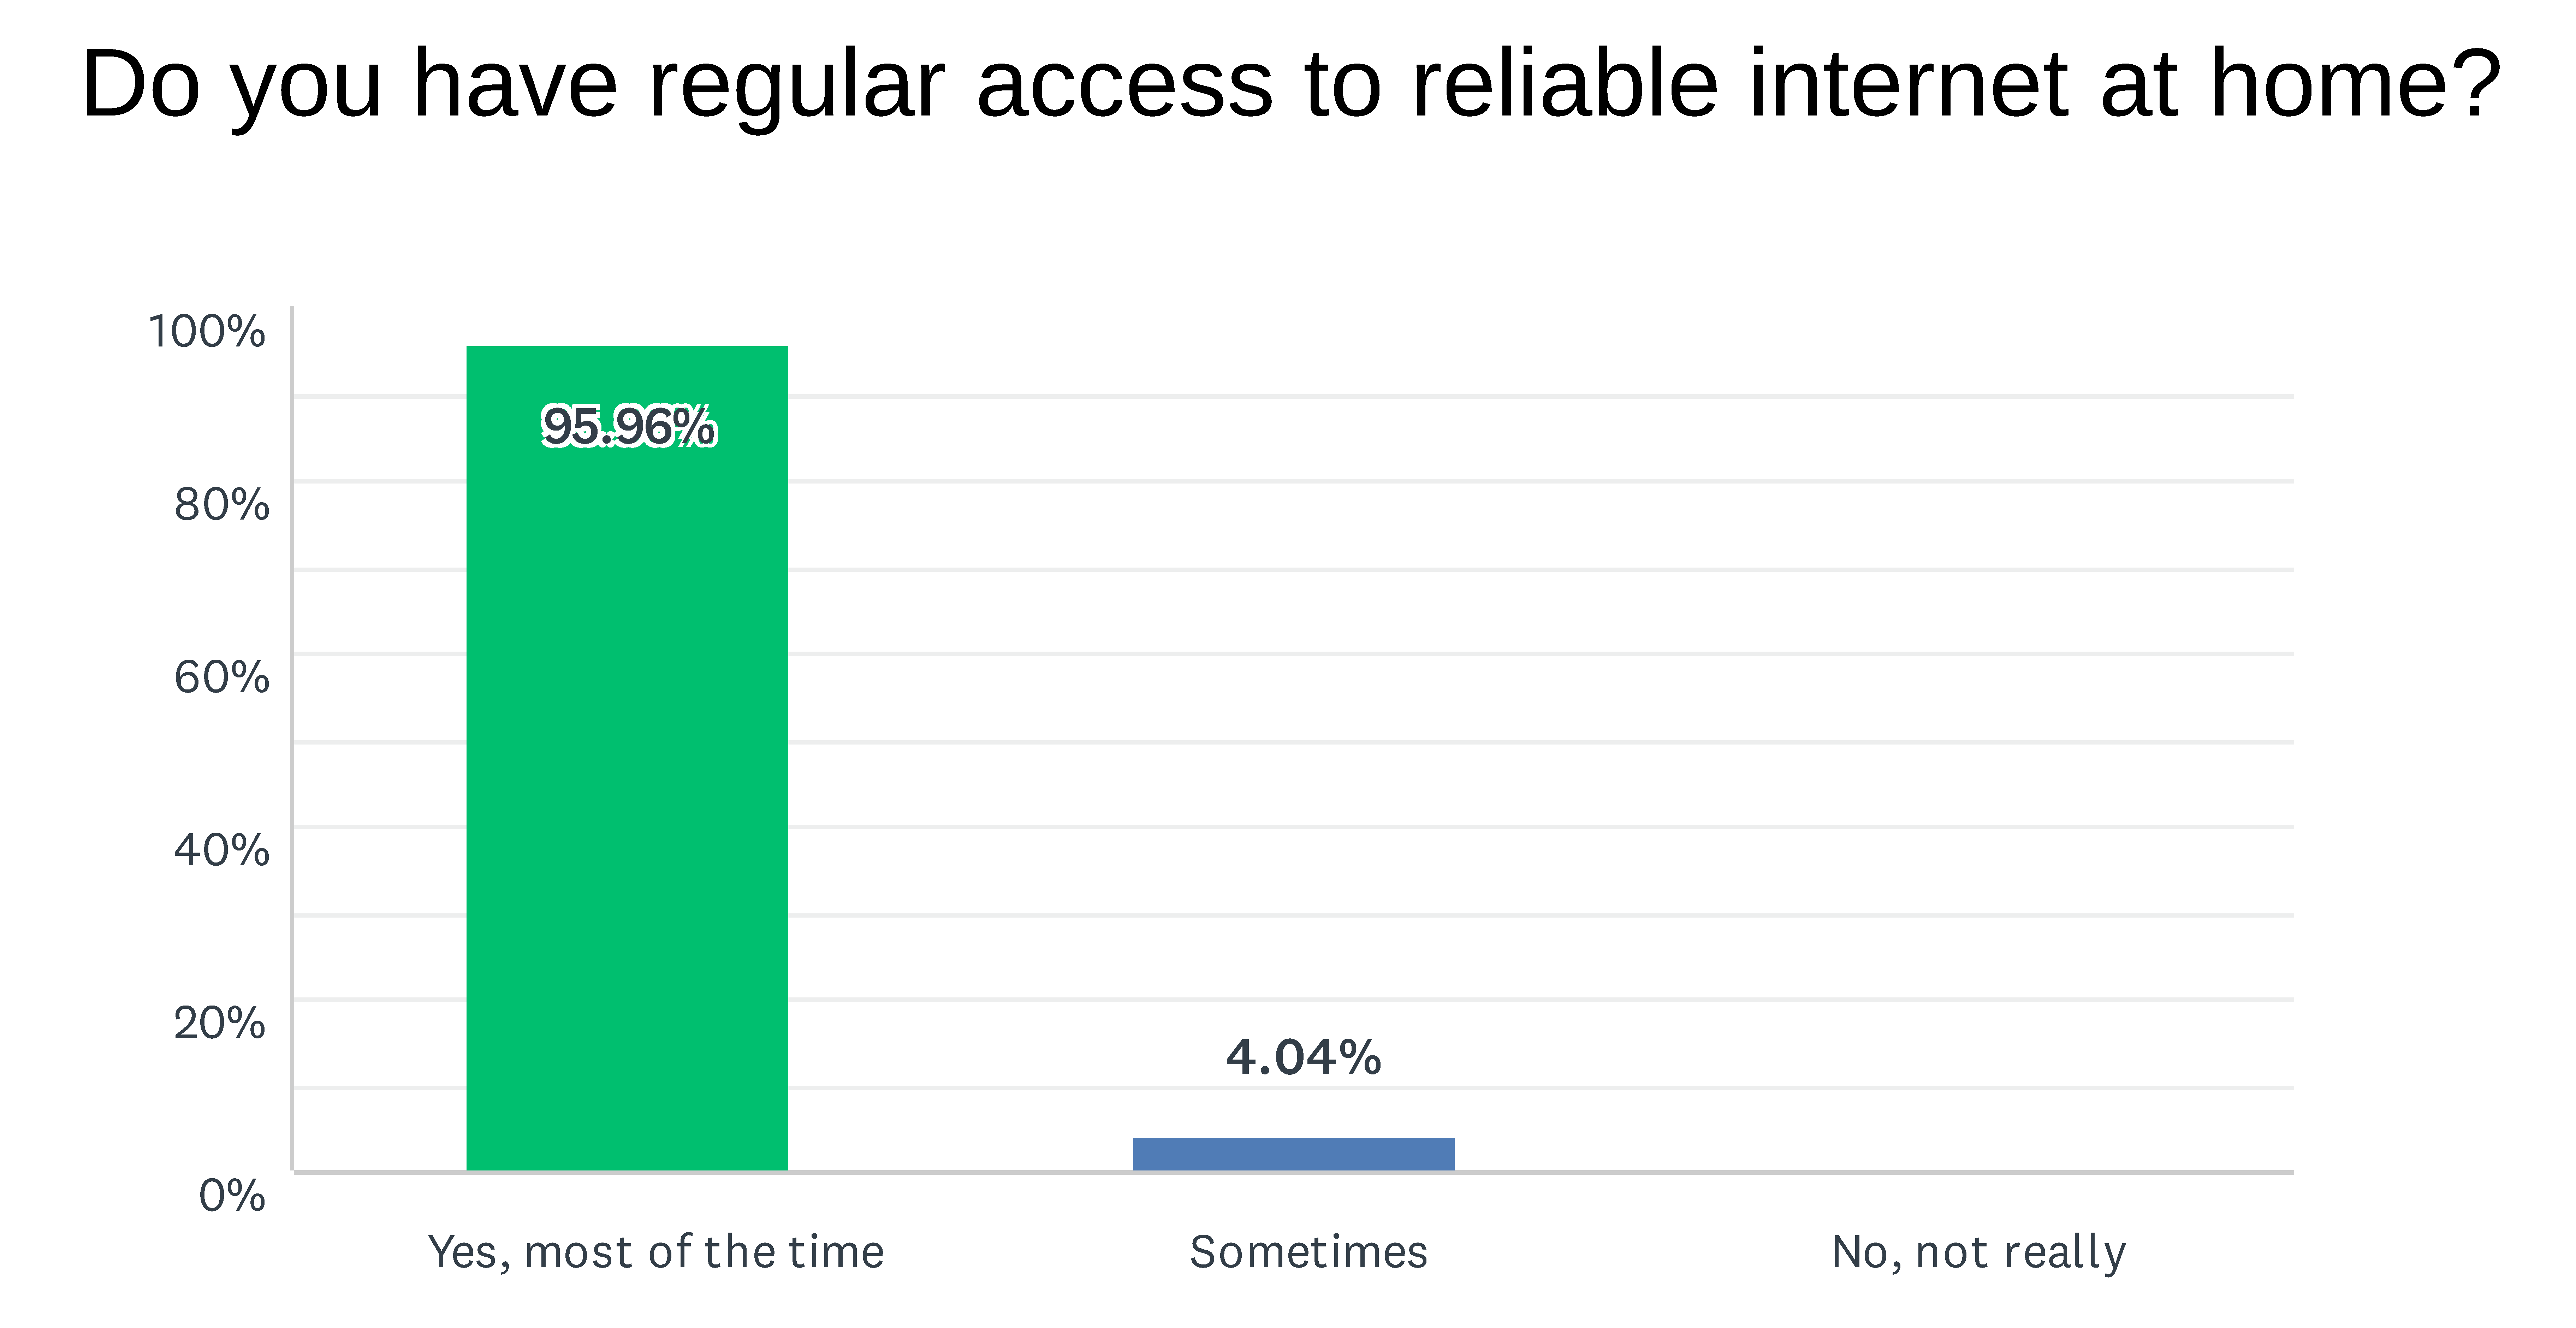
This is a potential example of non-response bias, as your survey did not capture responses from those students with unreliable access to internet. As such, you would not be able to draw any conclusions about students’ need for loaner laptops and wi-fi hotspots, since your survey did not capture responses from the students most likely to experience this need.
People may not respond to surveys for a variety of reasons. Some of the more common include:
- Lack of access to internet/technology: As in the example above, it can be challenging for individuals who lack regular access to internet or technology to respond to an online survey.
- Time commitment and demands of the survey: Busier individuals may not respond, especially if the survey is lengthy and requires multiple open-ended responses.
- Anonymity concerns/risk to responding: If people perceive a risk in responding to the survey, and little to no clear benefits, they are unlikely to respond.
As you review your survey results, it’s helpful to keep these and other potential reasons for non-response bias in mind.
3. Identify relevant questions
Your survey may contain a range of questions that can help inform your analysis (such as demographic questions), but do not directly provide the answers you were seeking. During an initial review of your survey responses, it can be helpful to identify those questions that are most relevant to what you originally wanted to learn. This can help you avoid getting distracted or overwhelmed by all the data available.
Suppose, for example, you wish to learn whether your institution’s career services center was meeting students’ needs. Key survey questions that could help you answer this question include:
- “How likely are you to visit the career services center in the future?”
- “On a scale of 1-5, rate how helpful you found the services that you received.”
- “Would you recommend the career services center to your peers?”
Once you’ve identified relevant survey questions, make note of any additional questions that come to mind during your initial review of the data.
4. Conduct a deeper analysis: identify who said what
Now you’re ready to look at the survey responses more analytically. Many survey platforms can help you filter by specific subsets of respondents and produce crosstabs (cross tabulations).
Filtering by specific subsets of respondents can help you focus your analysis. For example, you might be interested in diving deeper into the responses of first-year students because you’re considering changes related to onboarding or enrollment. Filtering your results by first-year students would help you accomplish this, allowing you to see the responses for first-year students without additional noise in the data by temporarily excluding other respondents.
Crosstabs are commonly used to look at how distinct groups of respondents answered questions to identify patterns. A crosstab is a table that helps you understand the relationship between two or more variables. For example, suppose you were interested in learning whether students who had attended your institution for less than a year had applied for a specific financial resource. A crosstab report could help you see the breakdown of responses to this question: “Have you applied for [financial resource]?” by how long students have been at the institution. Below is a simplified example. (Note that this example is designed to introduce the concept of crosstabs as an analytical tool. Crosstabs typically contain much more detailed information than this).
![Example simplified table that shows the breakdown of responses to the question "have you applied for [financial resource]" by how long respondents have been at the institution.](https://studentcentereddesign.org/wp-content/uploads/2021/08/Example-simplified-crosstab-6.png)
While there are many additional and more advanced methods of survey analysis, filtering by subsets of respondents and crosstabs are two of the most frequently used methods to analyze survey data on a more granular level. They are especially useful if you’re interested in learning about the experiences of different subsets of survey respondents.
5. Determine if you need additional data
After analyzing your survey responses more carefully, you may still have questions that can only be answered through different and/or additional data sources. Perhaps the survey didn’t sufficiently answer your initial questions, or it generated new questions.
Surveys can usually tell you how respondents are experiencing your program or institution, and what their experience has been thus far, but they don’t always help you understand why respondents have had these experiences, or why they responded in the way that they did. Surveys can also be limited when it comes to understanding respondents’ motivations, so additional methods of feedback and data collection, such as interviews and focus groups, can provide you with the insights and context that your survey responses may lack.
Surveys are central to SJI’s Student-Centered Design work: we are effective at helping colleges to design programs and services around what works best for their students largely because we make the time and effort to feature the student voice. So, we are strong proponents of organizations choosing to conduct surveys of their participants to help them make meaningful program improvements. At the same time, we understand that good survey analysis takes time, effort, and practice. While this primer only scratches the surface, our hope is that going through these 5 steps can help you lay the groundwork for conducting a thorough analysis. This in turn can help you pinpoint the most pertinent and valuable insights in your survey data and, ultimately, center your participants in the work that you do.